
Data on safety, policing and incarceration in New York City
Vital Signs is a feature designed to equip our readers with basic facts about the operation of the city's criminal justice system.
Access to information is a cornerstone of democracy, but clear facts are often hard to come by. Justice system data, in particular, are often partial, irregularly issued and hard to put in context for experts and laypeople alike. This can produce a dizzying array of apparently conflicting facts and incomplete answers that can infect public discourse and make it difficult for New Yorkers to feel they're on firm ground.
Because civic issues have a broader set of solutions than the justice system alone can offer, we will be expanding this feature to include markers of the city's vitality and its residents' well-being, as well as analyses of some of the more perplexing issues facing New Yorkers.
We hope that Vital Signs will help readers assess for themselves how things are going and what needs improvement. Readers interested in more in-depth information can download it from our Data Hub. We welcome your thoughts and suggestions about what else you think could be helpful: info@vitalcitynyc.org
What follows is our round-up of 2022 crime and justice trends in New York City.
1. Summary of the city's crime and justice trends
The period from 2017 to 2019 marked an all-time low in the city's crime and incarceration rates. For New York City, which for some time had touted itself as the safest large city in the United States, the new lows were a particularly remarkable achievement. Many remembered the early 1990s in the city, when annual murders hit an all-time high of 2,245 people killed and a record 21,674 jailed.
In May 2020, the crime picture changed radically, and peculiarly. As the city began to reopen from the global pandemic, shootings spiked, doubling between 2019 and 2020 — the single steepest one-year increase in decades and a 10-year high. But other major crimes remained relatively flat.
In 2021, shootings and murders remained at the elevated rates hit in 2020 but did not increase further. Major crime continued to remain largely similar to pre-pandemic levels.
In 2022, murders and shootings both moderated, falling slightly from the 2020 and 2021 levels but still well above pre-pandemic levels. Major crime, which had remained stable during 2020 and 2021, now became a cause for concern, jumping 23%. Car thefts rose 32%, robberies 26%, grand larceny 25% and burglaries 22% in 2022 compared to the previous year.
Figure 1: Compared to 2021, major crime rose 23% in 2022. Murders and shootings are abating — but remain well above 2019 levels
Figure 2: Shootings doubled from 2019-2020, and as of 2022, they remained 67% above 2019 levels
By the end of 2020, the number of shootings in the city had almost doubled (up 97%) from the year before, and the number of murders had increased 44.8%.
Figure 3: Murders increased by 47% in 2020, and as of 2022, remain 37% above 2019 levels
Given these significant increases in murders and shootings from 2019 to 2020, it was confounding that over the same period, serious crime in New York City (the seven major felony offenses reported weekly by NYPD: murder, rape, robbery, felony assault, burglary, grand larceny and grand larceny auto) was near a record low.
Figure 4: Major crime is up 32% since 2019, and it has increased 23% since 2021
While crime is higher than it was in 2019, murders and shootings are at about the levels that they were in 2012 during Mayor Bloomberg's administration. And the city is a far different place from the early 1990s, when murders were over five times what there were in 2022 and the city's jails held nearly four times the number of people as today.
Figure 5: Since 1990, murders and the number of people in jail have dropped 80% and 72%, respectively, and shootings have declined by 75% since 1993
2. Drilling down: Violence is concentrated in a few places
New York City's relatively low shooting rate masks the high concentration of violence in two of the city's five boroughs and in 10 of the city's 77 precincts.
Since 1993, Brooklyn and the Bronx have accounted for approximately two-thirds of citywide murders despite making up less than half of the city's population. In 1993, the citywide murder rate was 31 per 100,000 residents, but the Bronx led the city with 54 murders per 100,000 residents. Manhattan and Brooklyn each had rates of 33 murders. By 2019, the murder rate had dropped to 6.1 in the Bronx, four in Brooklyn and approximately three in the three other boroughs.
From 2019 to 2021, Manhattan and the Bronx saw the largest murder-rate increases, with each borough experiencing a 66% increase. In 2022, the Bronx continued to experience the highest murder rate of nine, about twice as high as Manhattan's rate of 4.6.
Figure 6: The Bronx's 2022 murder rate is triple that of Queens
The same pattern of concentration of violence in the Bronx and Brooklyn holds with shootings as with murders. Since 1993, Brooklyn and Bronx shooting incidents have accounted for nearly seven in 10 total citywide shootings despite making up less than half of the citywide population. In 1993, when the citywide shooting rate was 72 per 100,000 residents, the Bronx and Brooklyn had the highest shooting rates, with 106 and 102 shootings per 100,000 residents, respectively. This was nearly double the rate in Manhattan and nearly three times the rate in Queens. During the recent spike in shootings in 2020 and 2021, the Bronx experienced the greatest rate increase, jumping 119% between 2019 and 2021, from 16 shootings per 100,000 to 35.
Figure 7: The Bronx's 2022 shooting rate is more than double Manhattan's
Shootings are highly concentrated in just a few neighborhoods. Since the 1990s, despite dramatic reductions in the number of shootings, approximately the same 10 precincts out of 77 accounted for one-third of the shootings, with rates far above the citywide rate. Seven of the top 10 shooting precincts in 2019 and six in 2022 were the same as those that led the city in 1993.
Figure 8: Precincts with the highest shooting rates in 2022 were in many cases the same as they were in 1993 and 2019, and the top 10 precincts by shootings again accounted for a third of all shootings citywide
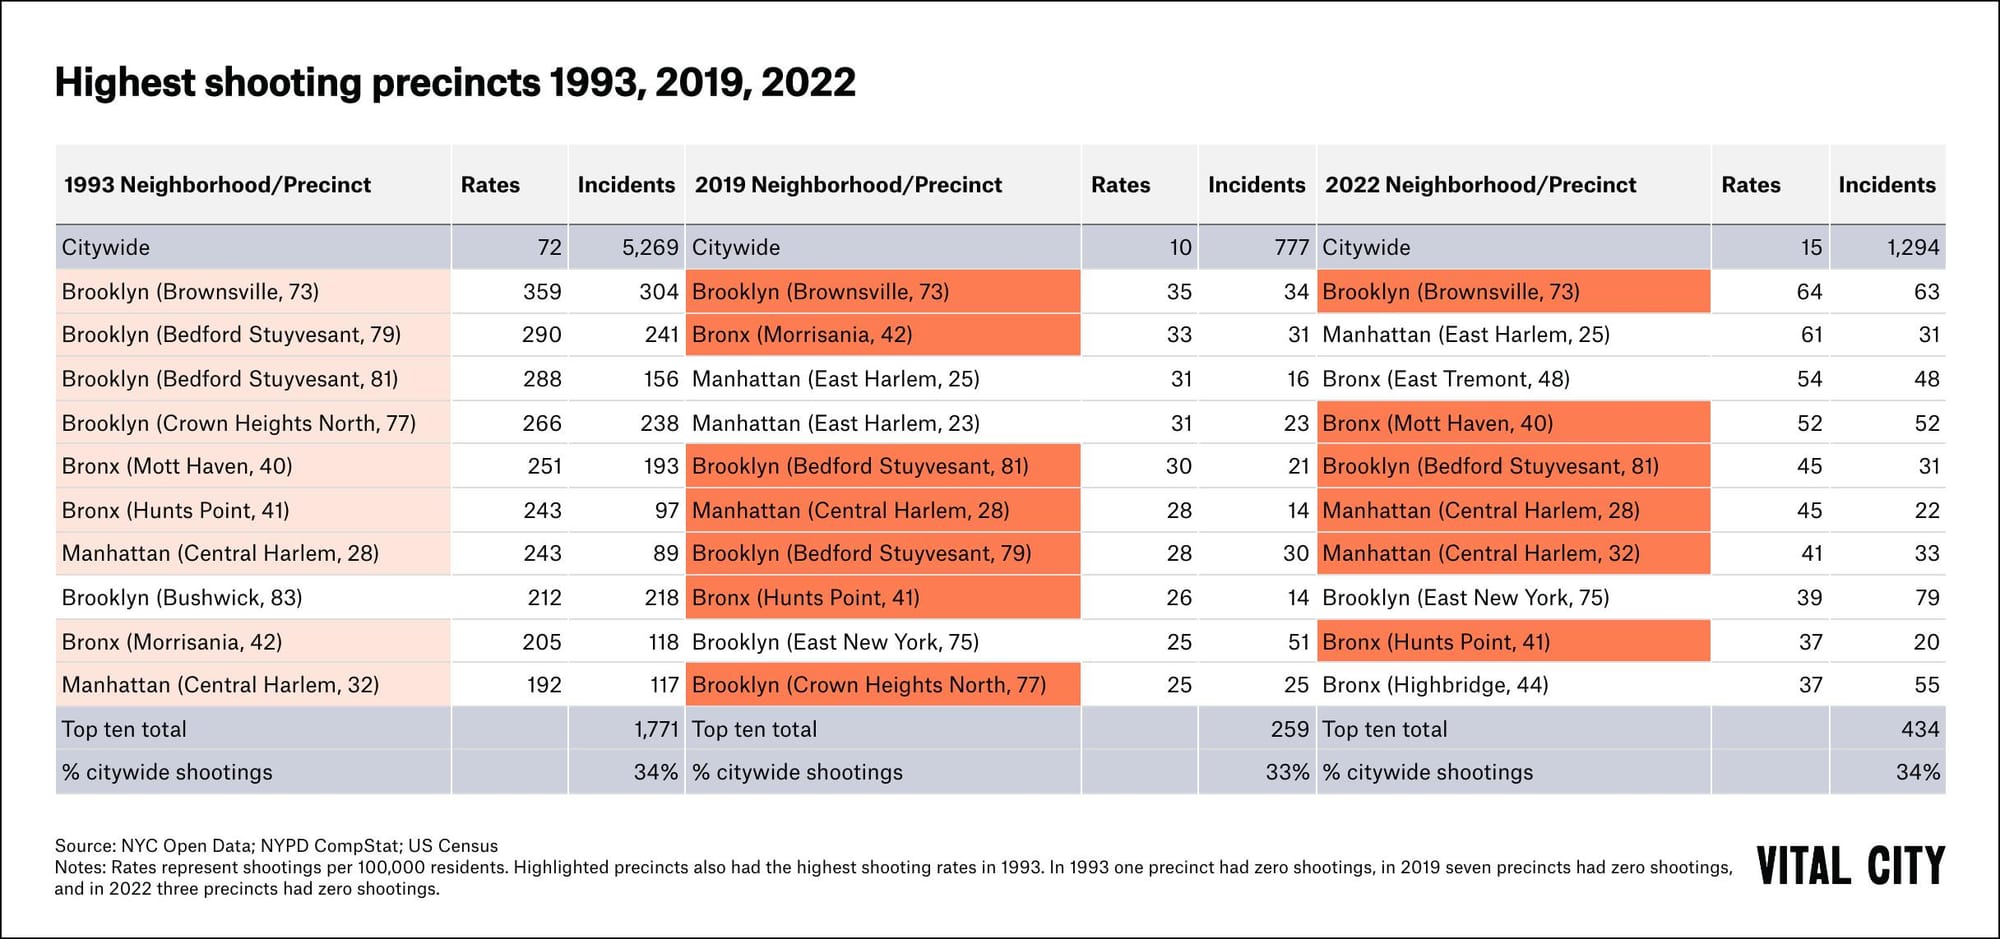
In Brownsville, which has led the city in shootings for decades, residents endured a shooting rate that was almost five times the citywide rate in 1993, three times the citywide rate in 2019 and more than four times the citywide rate in 2022. At the same time, a number of precincts experienced no shootings at all: one precinct in 1993, seven precincts in 2019 and three precincts in 2022.
3. Drilling down: Transit crime is up
As ridership fell during the pandemic, so did crime underground. Transit crime complaints fell starkly from 2019 to 2020, as ridership dropped sharply from pre-pandemic levels of 4.6 million riders a day to a low of 1.2 million riders a day.
Last year, as ridership peaked at about 60% of pre-pandemic levels, crime increased substantially. From 2021 to 2022, subway crime complaints rose 30%, with 2022 overall crime complaints returning to slightly less than 2019 levels (down 6% from 2019 to 2022).
Compared to 2019, felony crime complaints in transit have declined 20%, while misdemeanor crime complaints rose by 3% and violations rose by 14%. But with ridership down, the rate of crime in the subway system is now up 53% compared to before the pandemic.
Also, in 2022, there were 10 murders in the subway system — a sharp rise from prior years (seven in 2020 and 2021 and an average of two in the previous five years). While those bare numbers do not significantly influence overall felony counts, murder is the most serious of crimes and helped shape the public's perception of the system's safety.
Figure 9: Transit crime in 2022 was nearly at 2019 levels, despite 40% fewer straphangers
4. Drilling down: Housing authority crime is up
Crime complaints reported in New York City public housing fell from 2019 to 2020 by 6%, with a 14% decline in misdemeanor complaints driving the decline. By 2022, the volume of crime complaints had returned to, and slightly exceeded, 2019 levels overall, but felony crime had risen by 16%, with nearly 1,400 additional felony crime complaints.
Figure 10: Housing Authority crime remains 3% above 2019 levels
5. Drilling down: Youth crime in context
From 2019 to 2022, the number of felony arrests for dangerous weapons for all age groups increased by 11% (up 570) and from 2021 to 2022, increased by 10% (up 520). Between 2019 and 2022, young people aged 17 and younger accounted for 7% of these arrests, compared to 35% for young adults ages 18 to 24 and 57% for adults aged 25 and older.
While the number of weapons possession arrests for all ages has increased since 2019, the proportion of these arrests attributed to young people ages 17 and younger has fallen from an average of 9% from 2006 to 2018 to an average of 7% since 2019, when New York State's Raise the Age policy reforms were fully implemented. The proportion of these arrests attributed to adults ages 25 and older increased following Raise the Age implementation, accounting for 55% of these arrests prior to 2019, and 57% from 2019 to 2022.
Figure 11: Although arrests for dangerous weapons are up, New York's youngest residents are making up a smaller proportion of these arrests
In 2020, the number of individuals victimized by shooting incidents doubled from the previous year, remaining high into 2021. 2022 saw a 15% decline in victimizations but remained 76% higher than 2019 levels. This increase in shooting victimizations has disproportionately affected children and teens: the number of young people aged 17 and under who were victimized by shootings increased by 130% (+90) from 2019 to 2022 compared to an increase of 72% among adults 18 and older.
Despite the large increase in youth shooting victimizations from 2019 and 2022, young people aged 17 and younger accounted for 8% of these victims, compared to 29% for young adults ages 18 to 24 and 63% for adults aged 25 and older.
Figure 12: The surge in shooting victimizations disproportionately affected those under 17
6. How New York City fared in comparison to other large cities
The stark rise in murders and shootings experienced in New York City also afflicted other large cities in the United States, and compared to the U.S. average and other cities, New York City's murder and shooting rates are low.
New York City murder rates in 2022 were 2% below the national average, 49% below Los Angeles and 80% below Chicago and with shootings 47% below Los Angeles and 86% below Chicago.
Figure 13: New York's murder rates are far lower than Chicago's, Los Angeles' and the U.S. overall
Figure 14: New York City shooting rates are below Chicago's, Los Angeles'
7. Arrests and solved cases
While the causes of the increases in crime, both in New York City and across the country, are hotly debated, one important trend to follow is how the police are doing in arresting people who have committed crimes and in solving crimes. (We have written elsewhere about the many other ways, outside the criminal justice system, that safety can be created. In this report, we cabin our discussion to the justice system.) Most agree that within the ambit of the criminal justice system's powers, solving crimes is the key both to reducing crime and increasing trust.
For murder cases, the solve rate declined from 71% in 2017-2019 — when the number of murders committed was at its lowest point since 1952 — to 56% in 2021. As of October 2022, the last time NYPD released these statistics, that rate had returned to 64%.
Shootings show a similar pattern. Shooting clearance rates declined from 47% in 2019 to 36% in 2021. As of October 2022, the last time NYPD released these statistics, the rate had increased to 43%.
What explains the rising clearance rate? Since June, murder and shooting arrests as well as arraignments (signaling the evidence supporting the arrest was sufficient to withstand prosecutor scrutiny) sharply increased, coinciding with a sharp decrease in shootings and murders. From August to December, murders are down 21% and shootings are down 27% compared to the same period in 2021, while murder and shooting arrests have reached historic highs. There is some evidence that increasing the certainty of arrests and clearing crimes has a strong deterrent effect.
For all major crimes, however, a low solve rate (approximately 35% in 2019) has dropped even further to 29% as of June 2022, the last time NYPD released these statistics, a cause for deep concern, particularly as we see the commission of major crimes rising significantly.
Figure 15: Clearance rates are below 2019 levels for major crimes overall, as well as for shootings and murders
While arrests for murders and shootings increased as the commission of those crimes decreased, the same has not been true for major crimes. Major felony crime increased by 32% from 2019 to 2022, and the number of felony arrests remained stable. In 2019, there were 0.59 felony arrests per every felony. In 2022, that had dropped to 0.48 felony arrests per every felony. At the same time, there has been a dropping conviction rate in those cases that do proceed to prosecution. The conviction rate for arraigned arrests is down for felonies from 58% in 2019 to 34% in 2021. Recent data show that the conviction rate increased modestly to 37% in 2022.
Figure 16: After reaching a low in July 2020, arrests for felonies and misdemeanors are increasing
8. How many New Yorkers are jailed and for how long
The size and composition of the jail population hold up a mirror to the operations of the rest of the justice system. For example, how many people are admitted can reflect whether arrests are up or down, and how many people are in at any one time (the average daily population) can reflect how speedily cases are being considered and resolved. By the end of April 2020, about six weeks after the city shut down, the number of people held in jail reached a low not seen since the 1940s.
This was not an accident. COVID poses a special danger in congregate settings where the space to isolate or distance is compromised — so the city launched a concerted effort to coordinate with justice system decision-makers. Over the course of six weeks, they organized to release, temporarily or permanently, over a third of the standing jail population.
Figure 17: By the end of 2022, the citywide jail population was 30% below January 2019 levels
The size of the jail population has since increased and its composition has changed. The proportion of people held on violent felony charges has increased by 21 percentage points, from 49% in December 2019 to 70% in December 2022 while the percentage of people held on state technical parole violations went from 12% to less than 1%. Between December 2019 and December 2022, the proportion of people serving out post-conviction city sentences more than doubled, rising from 3% in 2021 to 7% of the jail population in 2022. The proportion of people charged with nonviolent felonies rose modestly, while the proportion of people charged with violent felonies declined.
Figure 18: From 2019 to 2022, the jail population composition changed with an increase in people held on violent felony charges and a decline in people held on state technical parole violations
In large part, the increase in population is caused by the ever-lengthening amount of time that people are staying in jail due to the difficulty in moving cases. While on average in 2019, 15% of the population (1,108 people) were in for over a year, that percentage rose to 26% (1,499 people) in 2022.
Figure 19: The number of people held in city jails for more than one year is down substantially from January 2022, but still high when compared to 2019 and 2020


