
Crime and justice trends in New York City.
Vital Signs is a new feature to equip our readers with basic facts about the operation of the city's criminal justice system. Because civic issues have a broader set of solutions than the justice system alone can offer, we will expand this set of facts to include markers of the city's vitality and its residents' well-being, as well as analyses of some of the more perplexing issues facing New Yorkers.
Access to information is a cornerstone of democracy, even though it is hard to come by. Justice system information, in particular, is often partial, irregularly issued and sometimes opaque, hard to aggregate and put in context for both experts and laypeople. All of these defects produce a dizzying array of apparently conflicting facts and incomplete answers that can, often for worse, infect public discourse and make it difficult for New Yorkers to feel on firm ground.
We hope that Vital Signs will help readers assess for themselves how things are going and what needs improvement. Readers interested in more in-depth information can download data from the Data Hub. We welcome your thoughts and suggestions about what else you think could be helpful: info@vitalcitynyc.org
1. Summary of the city's crime and justice trends
The period from 2017 to 2019 marked an all-time low in the city's crime and incarceration rates. For New York City, which for some time had touted itself as the safest large city in the United States, the new lows were a particularly remarkable achievement. Many remembered the early 1990s in the city when murders hit an all-time high of 2,245 people killed and a record 21,674 jailed.
2. Crime – New York City
But in May 2020, the crime picture changed radically, and peculiarly. As the city began to reopen from the global pandemic, shootings spiked.
By the end of 2020, the number of shootings in the city had almost doubled (up 97%) from the year before, and the number of murders had increased 44.8%.
It was confounding then that in the face of spiking violence in 2020, serious crime in New York City (the seven major felony offenses reported weekly by NYPD) was near a record low.
While some pandemic-related trends of opportunity emerged (for example, burglaries of commercial establishments and dwellings), for the most part, the troubling increases were cabined to shootings and murders, a trend shared by most of the big cities in the nation.
3. How New York City and other large cities fared
The stark rise in murders and shootings experienced in New York City also afflicted other large cities in the United States.
Despite the well-founded, deep concern over the rising violence, New York City continued to maintain relatively low shooting and murder rates compared to the rest of the nation.
2021 saw a continuation of elevated rates of shootings and murders, but major crime rates remained largely similar to pre-pandemic levels. Shootings doubled between 2019 and 2020 — the single steepest one-year increase in decades and a 10-year high. But in 2021, they did not rise substantially further. And other major crimes remained flat through most of the year, only starting to rise by year's end to finish with a 7% increase. Although the 2019-2021 rise in shootings and murders was shocking, viewed through a longer lens, it brought the city back to approximately 2011 when Michael Bloomberg was mayor, a period remembered by some as one of stable safety. In a broader historical perspective, there were as few murders as in 1961 (483) before the big increases of the 1960s and 1970s.
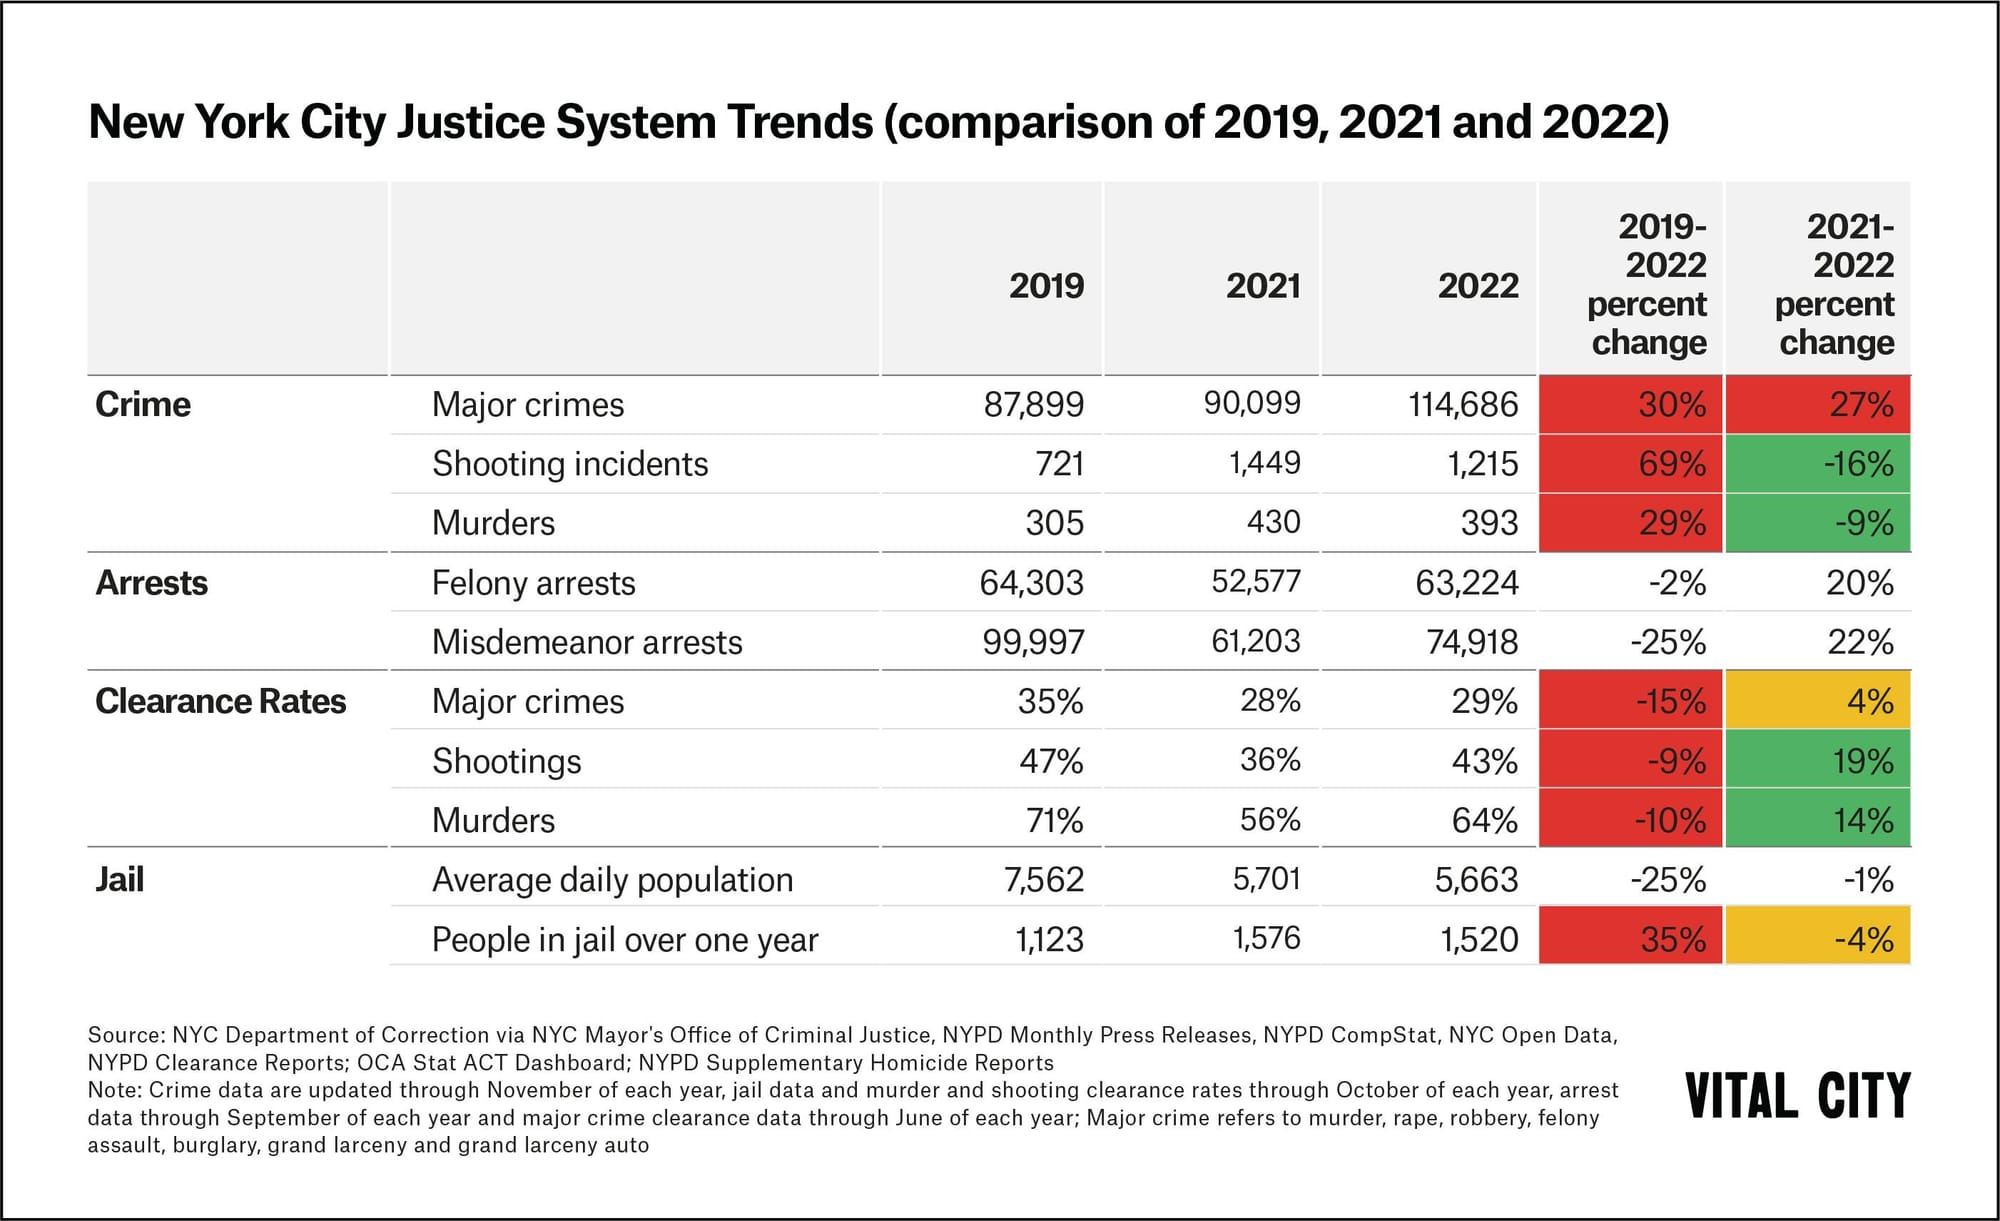
2022 has been a very different story. Murders and shootings have decreased, respectively, by 9% from 2021 (430 vs. 393) and 16% (1,449 shootings vs 1,215). This is good news, even if murders and shootings are still quite elevated from 2019 (respectively up 29% — 305 to 393, and 69% — 721 to 1,215).
Despite the moderating trendline for murders and shootings so far in 2022, the trend for major crimes overall gives cause for concern: a 27% increase in major crime through November and a massive increase in some categories that had been relatively stable in 2020 and 2021. For example, grand larcenies and car thefts are up 32%, robberies 28% and burglaries 25% over last year.
Viewed in comparison to other large American cities, New York City continues to have lower murder and shooting rates. The decline in both of those rates over the past year is encouraging while the increase in major crimes overall requires close attention and focused strategies to produce durable declines.
4. Arrests and solved cases
While the causes of the increases in crime, both in New York City and across the country, are hotly debated, one important trend to follow is how the police are doing on arresting people who have committed crimes and in solving crimes. (We have written elsewhere about the many other ways, outside the criminal justice system, that safety can be created. In this report, we cabin our discussion to the justice system). Here, most agree that within the ambit of the criminal justice system's powers, solving crimes is the key both to reducing crime and increasing trust. Yet for murder cases the solve rate declined from 71% in 2017-2019 — when the number of murders committed was at its lowest point since 1952 — to 56% in 2021. In 2022, that rate has now returned to 64%.
Shootings show a similar pattern. Shooting clearance rates declined from 47% in 2019 to 36% in 2021. In 2022 the rate has increased to 43%. What explains the rising clearance rate? Since June, murder and shooting arrests as well as arraignments (signaling the evidence supporting the arrest was sufficient to withstand prosecutor scrutiny) sharply increased, coinciding with a sharp decrease in shootings and murders. From August to November murders are down 30% and shootings are down 28% compared to the same period of 2021, while murder and shooting arrests have reached historic highs. It is some evidence that increasing the certainty of arrests and clearing crimes has a strong deterrent effect.
For all major crimes, however, the very low solve rate (approximately 35% in 2019) has dropped even further to 29% this year, a cause for very deep concern, particularly as we see the commission of major crimes rising significantly.
While arrests for murders and shootings increased as the commission of those crimes decreased, the same has not been true for major crimes. Major felony crime increased by 30% from 2019 to 2022, and the number of felony arrests has slightly decreased. In 2019, there were 0.59 felony arrests per every felony. But by 2022, that had dropped to 0.49 felony arrests per every felony. At the same time, there has been a dropping conviction rate in those cases that do proceed to prosecution. The conviction rate for arraigned arrests is down for felonies from 58% in 2019 to 34% in 2021. Current data shows that the conviction rate continues to be around 35% in 2022.
5. Jail
The size and composition of the jail population hold up a mirror to the operations of the rest of justice system. For example, how many people are admitted can reflect whether arrests are up or down, and how many people are in at any one time (the average daily population) can reflect how speedily cases are being considered and resolved. By the end of April 2020, about six weeks after the city shut down, the number of people held in jail reached a low not seen since the 1940s.
This was not an accident.
COVID poses a special danger in congregate settings where the space to isolate or distance is compromised. The City launched a concerted effort to coordinate with justice system decision makers (district attorneys, defenders, judges and others). On a daily and weekly basis, the principals and their staffs reviewed the case of every person in jail. In the course of six weeks, they organized to release, temporarily or permanently, over a third of the standing jail population.
The size of the jail population has increased since 2019 and its composition has changed. The number of people held on violent felony charges has increased from 2,881 in December 2019 to 4,114 in October 2022 — a 43% increase. Part of this is due to changes in State law that limit the reach of bail and detention and part has to do with the ever-lengthening amount of time that people are staying in jail due to the difficulty in moving cases. While on average, 15% of the population (1,108 people) were in for over a year in 2019, this year that percentage has risen to 27% (1,520 people).


