
As the possibility of a receiver for the city’s jails is considered, almost every measure of violence is well above the levels the court found unconstitutional in 2015.
What counts as progress? With violence spiking to rates not seen in decades and the issue of a federal receiver on the table, this is the central question for the City’s jails. This report tries to answer that question with the data that is available to the public. It also highlights the data that is missing or contradictory, omissions that potentially obscure whether conditions are better or worse. As the reader will see, often the data raises as many questions as it addresses, questions that are squarely within the purview of the City to answer.
We do not write in a vacuum. The City’s jails are in their eighth year under the supervision of a federal monitor, installed as the result of a consent decree aimed to control their “culture of violence,” specifically uses of force by correction officers. Since the start of this effort in 2015, the rate of death more than doubled (chart 2); the rate of slashings and stabbings has increased by 6.6 times (chart 3); uses of force resulting in serious injury by 9.6 times (chart 11); assaults on staff resulting in serious injury by 2.3 times (chart 13). Meanwhile, the budget of the department has continued to increase even though the number of people incarcerated has dropped. Today, it costs approximately $500,000 a year to incarcerate one person (chart 18) in part because the New York City jails have the richest staff-to-incarcerated-person ratio in the country. Since 2021, almost a third of the workforce has failed to come to work, which, combined with management failures, have further accelerated the intersecting crises in the jails.
Understanding the violence requires a detailed analysis of the conditions that spawned it. In thousands of pages since 2015, the monitor has chronicled the complete collapse of governance and management of the department, and a dramatic escalation in violence. In March 2022, the monitor issued a “special” report, noting the levels of dysfunction leading to the violence and lamenting that “these high rates are not typical, they are not expected, they are not normal.” (emphasis in original). The monitor’s latest report opens with the irrefutable truth about the unrelenting violence: “The conditions in the jail remain dangerously unsafe and the Monitoring Team remains gravely concerned about the alarming number of in-custody deaths [and] violence among people in custody, [among other things].…” But he tempers his cautions with encouraging news of some modest movement in process, for example, the hiring of some civilian supervisors.
We hope this report will assist in answering, as well as raising, questions about what or who is driving the violence, what impact Department of Correction policies are having and, most importantly, what is the most effective way to address the immediate and systemic overlapping crises on Rikers Island?
Vital City thanks the many organizations and people, both inside and outside the government, who have lent their deep expertise and knowledge to comment on and to supply data in this report. These include but are not limited to: CUNY Institute for State and Local Governance, Columbia Justice Lab and Campaign Zero. Any views expressed and errors made are Vital City’s alone.
Data notes:
- Data behind the charts is available for download here.
- Data sources in this report rely on two different timeframes, depending on how sources reported information: the fiscal year, which for New York City, begins in July and ends in June of the following year, and the calendar year. Charts are labeled to indicate which timeframe is being used.
Part I: The Human Cost
1. 2022’s death toll is the highest in 10 years, with six weeks to go in the year
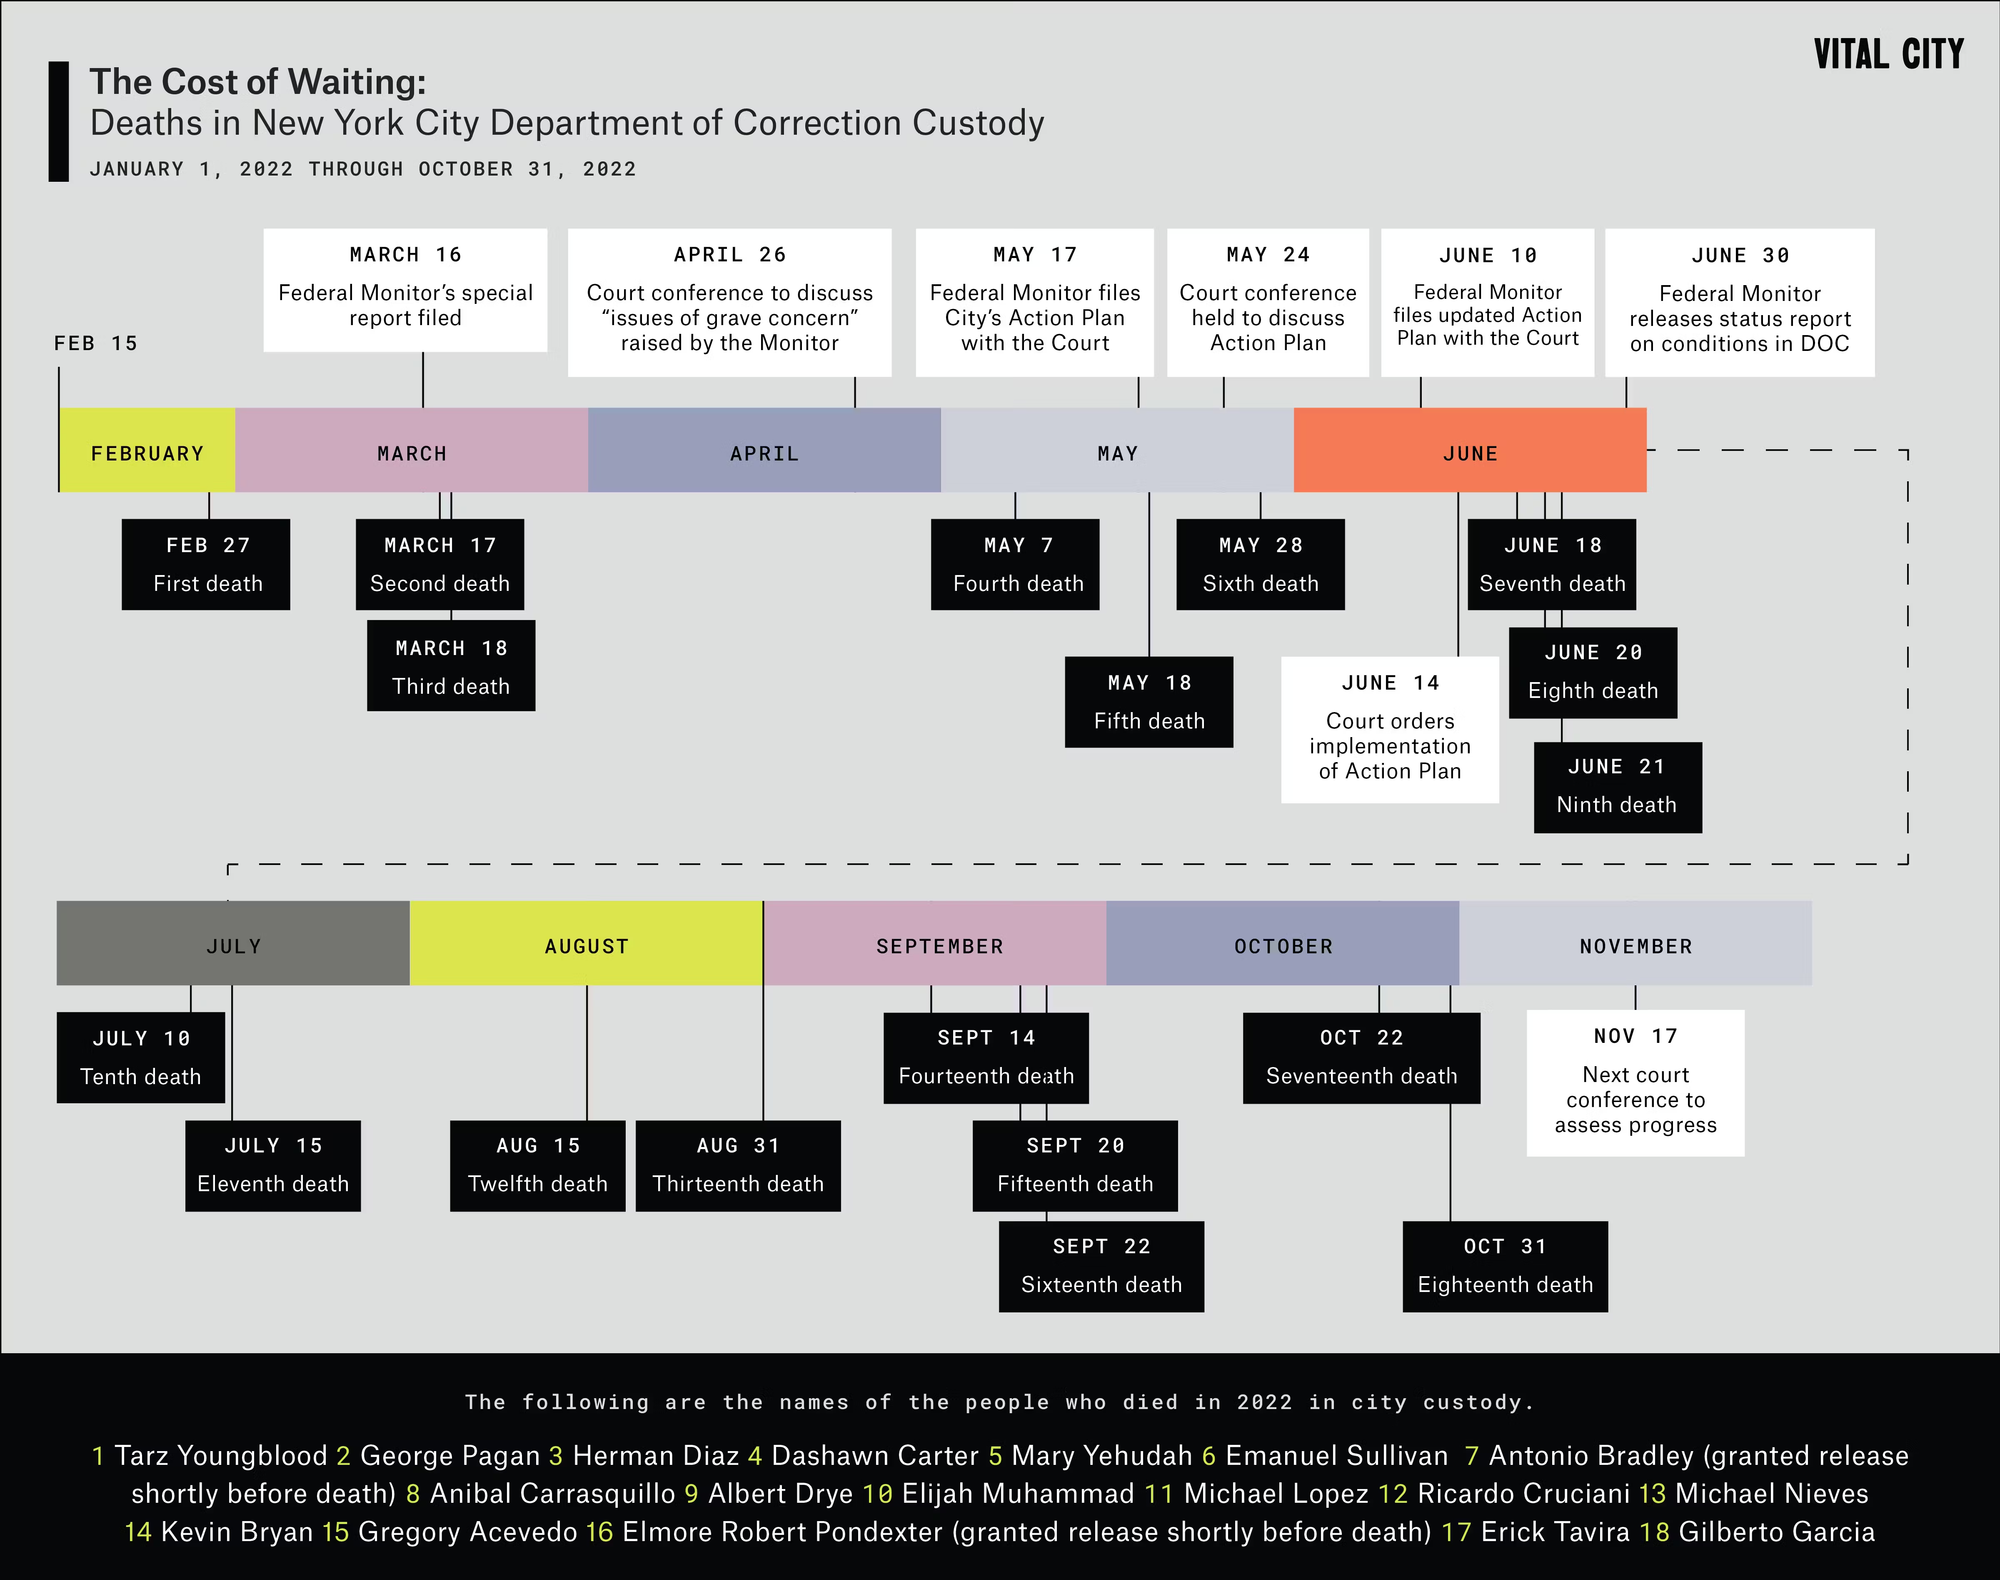
On October 31, Gilberto Garcia became the 18th person to die in the New York City jails this year, eclipsing the 16 jail deaths in all of 2021. The same day, in the same jail, a correction officer was stabbed 15 times in the head by a detained person.
One person was already dead when the monitor sounded the alarm in his March special report. Seventeen more have died since then.
2. The rate of death so far this year is more than 12 times the rate in 2019
The City’s jail population has decreased significantly since the beginning of the federal consent decree. Despite the reduction in the number of people incarcerated, the number and rate of deaths have skyrocketed, more than doubling the annual rate since the first year of monitor oversight.
3 and 4. The rate of stabbings and slashing are up 49% since FY1995 despite double the number of staff
While deaths should be unusual, stabbings and slashings offer one of the more stable indications of rates of violence. Unlike staff assaults, use of force incidents and incarcerated person fights, every stabbing and slashing must be reviewed by a medical team which is mandated to file a report.
Slashings and stabbings have been steadily on the rise since 2009. Whether examined as a rate or as an absolute number, stabbings and slashings spiked starting in FY21 and have remained unabated. Today, despite double the available staff, the stabbings and slashings rate is 49% higher than in 1995, one the most violent years in the jails’ recorded history.
5. A sharp increase in stabbings and slashings started in 2021…
If the current trend of slashing and stabbing incidents continues through the end of the year, it will be more than five times the 2019 rate and up 16% over the same period last year.
6. …and the high rate of stabbings and slashings — up 24% from this time last year — has continued through 2021 and 2022
Looking at slashing and stabbing incidents monthly shows the violence rising, starting in 2020. While there has been some month-to-month variation since then, the rate has continued to rise dramatically. The rate of stabbings and slashings is up 24% from the same period last year (73 for every 1,000 people through October 2022 compared to 59 for 2021). The rate of stabbings and slashings so far this year is over five times what it was for all of 2016, the first year of the consent decree (from 13.7 per 1,000 people in 2016 to 73 per 1,000 in 2022).
7. Stabbings and slashings are concentrated in a few jails, with rates shifting as policies change
8 and 9. Despite the shift in violence among facilities, the numbers consistently show the spike in violence in 2021, with totals remaining high month to month in 2022
The intake facility (OBCC) had the highest concentration of slashings and stabbings until it was closed in June 2021, in part to abate conditions. RNDC, which houses young men ages 18-21, and GVRC, which houses men considered high classification or maximum security, were the next most violent jails in the New York City system. Following DOC’s implementation of a violence reduction plan at RNDC, the number of incidents decreased and then markedly increased in GVRC.
The numbers alone do not answer the questions of why violence went up or down. And without more information, we are left with questions. For example, a number of the reported deaths occurred on unstaffed units, but we do not have staff absences by facility. Did violence spike where there were fewer staff? Did violence reduce in RNDC because tensions were resolved? Or because incarcerated people spent more time locked down? Or because people driving the violence were transferred elsewhere? Or because more or better trained staff was deployed? Or other reasons?
Similarly, why did violence rise so dramatically at GVRC? A different population? Fewer staff? Something else?
10. The rate of use of force per incarcerated person has tripled since the start of the consent decree…
11. …while the rate of use of force resulting in serious injury has risen over ninefold
Use of force incidents by staff against incarcerated people have gone up significantly since the start of the consent decree, reaching a high point of the past nine years in FY21, both by rate and by the absolute number of incidents. While reported incidents are down modestly from last year when measured as a rate of incidents per incarcerated person, they remain nine times the rate that they were when the consent decree started. The rate of serious injury resulting from use-of-force has now been on the rise in each of the last five fiscal years.
Here again, the reliability of the data comes into question as, unlike stabbings and slashings, use of force reporting is more variable. And when the uses of force are measured as a rate, either of the full complement of uniform staff on the books, or the actual number of officers who have shown up (a significant reduction, see chart 16) once again the story is of escalating force with higher rates of serious injury resulting.
12. The rate of assaults on staff has declined in the last year, although still 63% above the 2016 rates…
13. …with total assaults resulting in serious injury also reduced from last year while the rate of assaults per 1,000 incarcerated people remains similarly escalated from 2016
Assaults on staff and assaults on staff resulting in serious injury are one bit of bright news. Both are reduced by 41% and 31% since their peaks in 2021 and 2020, respectively. Notably, they are either flat or slightly elevated from the first year of the consent decree. Puzzling, though, is why this metric is down when every other violence metric is up. Reporting issues? Related to the broad absenteeism among staff? Something else?
14 and 15. While the data reflects a reduction in total fights among incarcerated people to near 2016 levels, the rate of fights resulting in serious injury have soared almost eightfold
The data is encouraging on its face with overall fights going down. However, it also raises questions about reporting: the substantial increase in stabbings and slashings, as well as inmate fights resulting in serious injury, while overall fights are declining may suggest that fewer fights are being reported, not that fewer fights are occurring. This would square with the reduction in staffing for the units — that is, there are fewer staff to observe and thus report the less serious incidents. Meanwhile, the required reporting that occurs when there is serious injury may be a truer measure of the conditions inside.
16. An unprecedented “sick-out,” resulted in 27% of the workforce absent in 2021 and similar rates this year
17 and 18. In addition to being richly staffed (see chart 3), the Department of Correction is also richly resourced, with budgets rising year after year both in real terms and as a rate as the jail population reduces.


