How urban centers beyond New York should think about public space and public safety
This is the multi-city implementation guidance of Rubber Meets Road: Lighting, a Vital City-Center for Justice Innovation series on lighting New York's streets to make them safer. Read alongside it: a summary of the Rubber Meets Road project, the summary overview of the problem and solutions, a detailed implementation roadmap, Aaron Chalfin on 50 years of research, a design deep-dive, maps overlaying crime with satellite-measured darkness and 311 outage complaints, and a proof-of-concept app for reporting dark blocks.
For every city seeking to reduce crime and violence, street lighting is a part of the solution. But figuring out where lighting improvements could most reduce crime is easier said than done.
While crime data are readily accessible, lighting data are not: police departments track criminal complaints in great detail but few cities have comprehensive maps of their streetlights, let alone of the many more lights mounted on public and private buildings, or of the kinds of ambient light that streams from apartments and storefronts. This leaves policymakers largely in the dark about where lighting ought to be improved.
Vital City has created a prototype mapping tool to fill this gap. This tool merges nighttime satellite images with geolocated crime data to show where poor lighting and high rates of nighttime violent crime overlap. In New York City, it flagged 2% of the city’s land area that was both darker than the city median and in the top 20% for nighttime violent crime — about 1,000 blocks — illustrating how any city can identify where better lighting has the greatest potential to enhance public safety.
This document provides some tips on how to replicate the tool for any city in the United States.
Overview
Every night, a joint NASA-NOAA satellite carrying an instrument called the Visible Infrared Imaging Radiometer Suite, or VIIRS, flies over the U.S. and produces images at a 500-meter resolution that can be used to calculate surface brightness in every major city.
NASA combines the nightly images into a monthly composite, screening out nightly observations obscured by clouds and correcting the remaining readings for atmospheric distortions. Because each pixel covers a 500-meter square — several city blocks — the readings represent average brightness over an area, and cannot pinpoint lighting problems on a particular corner or street segment. This limitation means cities should take further steps before drawing any conclusions.
By combining these images with incident-level data on outdoor nighttime violent crimes — misdemeanor and felony assaults, robberies and homicides — policymakers can identify the places where darkness and violence overlap.
How to build it
1) Acquire nighttime lighting data
A city can obtain nighttime lighting data from NASA’s VIIRS Black Marble Level-3 product, VNP46A3, a monthly composite of images built from nightly satellite passes. The imagery is completely free. Because most cities lack street-level lighting data, this satellite imagery is the most practical publicly available source for consistently measuring and comparing nighttime brightness across large areas and over time. More localized sources may provide more precise street-level measurements but do not offer the same consistent and scalable coverage.
2) Extract radiance values, narrow to grid cells overlaying the city, and fill empty values
The city should extract the radiance values, which measure surface brightness at night, and narrow the analysis to the grid cells that overlap with the city. For New York City, this produced a grid of 5,559 cells, which together cover the entire city, including its waterways and shoreline. Each cell that falls on land spans several city blocks.
Some cells will have no valid reading in a given month. The city should fill these gaps before averaging. For New York City, Vital City filled each empty cell with the mean of the three nearest cells that had valid values that month, treating each month separately.
3) Calculate a multi-year estimate
NASA filters out obscured or distorted images and VNP46A3 ships with a per-pixel quality flag and with layers recording how many valid observations went into each pixel and how much they varied.
Even so, monthly composites can vary significantly due to temporary conditions (for example, bright lights illuminating a construction site) and seasonal factors (such as snow on the ground, which is highly reflective, or leaves on trees). To smooth out this variation, the city should combine the monthly composites over a multi-year period to provide a stable average lighting estimate for every grid cell in the relevant area.
For New York City, Vital City averaged the 36 monthly composites covering 2022 through 2024, weighting each month equally, to create a three-year average. The results measure each cell’s persistent ambient nighttime brightness, rather than momentary or seasonal fluctuations.
4) Acquire and clean crime data
The city should obtain geocoded crime data from the relevant local government agency. Past studies link improved street lighting most strongly with reductions in nighttime violent crime, so the city should first filter the data to violent offenses (misdemeanor and felony assault, robbery and homicide) and exclude incidents that are not reliably geocoded.
For New York City, Vital City used publicly available New York Police Department incident data and excluded rape and shooting complaints because the NYPD sometimes geocodes those incidents to the police precinct where they were reported rather than the precise location where they occurred.
5) Set temporal and spatial parameters
To focus on incidents most likely to be affected by improved lighting, the city should limit the data to crimes that occurred between the end of evening “civil twilight” and the start of morning “civil twilight” — the period when natural light has faded sufficiently that artificial lighting matters. Because these boundaries shift with the seasons, they capture nighttime more accurately than a fixed window such as 8 p.m. to 6 a.m.
The city should also limit the data to incidents the police department’s location codes place in public outdoor settings. For New York City, these included streets, highways, bridges, tunnels, open lots, parks, playgrounds, cemeteries, parking lots, bus stops, bus terminals, ferry terminals, taxis, marinas, piers, mobile food locations, outdoor mailboxes and construction sites.
6) Merge the crime data with each grid cell
The city should join the crime incidents to the satellite grid cells and count the total number of outdoor nighttime violent crimes in each cell.
7) Set thresholds and find the overlap
To identify areas where darkness and danger overlap, the city should choose thresholds to define “low lighting” and “high crime.”
For New York City, Vital City defined “low lighting” cells as those at or below the 50th percentile of average radiance, a broad standard meant to encompass anywhere lighting might be insufficient.
Vital City defined “high crime” cells as those at or above the 80th percentile of nighttime violent crime counts. There is no fixed standard for where to set this cutoff, so Vital City chose one that captures most of the problem while leaving a workable number of candidate sites: the top 20% of cells accounted for roughly 79% of nighttime violent crime from 2022 to 2024, and 81 of those cells were darker than the city median. (A stricter 90th-percentile cutoff would have left only 13 cells meeting both conditions.) Because this is a practical default rather than a finding, the prototype lets users move the threshold themselves.
Vital City set percentile thresholds, rather than absolute radiance values or raw crime counts, for two reasons. First, because the satellite images capture average brightness across several city blocks rather than on any individual block, the data are better suited to comparing cells against one another than to measuring them against an absolute standard. Second, percentiles provide a clear and consistent basis for prioritization; a cell matters because it is darker and more dangerous than half of the other cells, not because it crosses an arbitrary absolute threshold.
8) Aggregate to other administrative geographies
The fundamental analytic unit of the satellite data is the grid cell, but for practical decision-making the results should be aggregated to geographic boundaries that municipal agencies would recognize, such as neighborhoods, wards or city council districts. For New York City, Vital City aggregated cell-level results to Neighborhood Tabulation Areas (NTAs) and police precincts, computing for each the number of priority cells and the total number of nighttime violent crimes contained within those cells.
9) Add other data of interest
The city can also incorporate other datasets that describe the built environment or flag safety concerns.
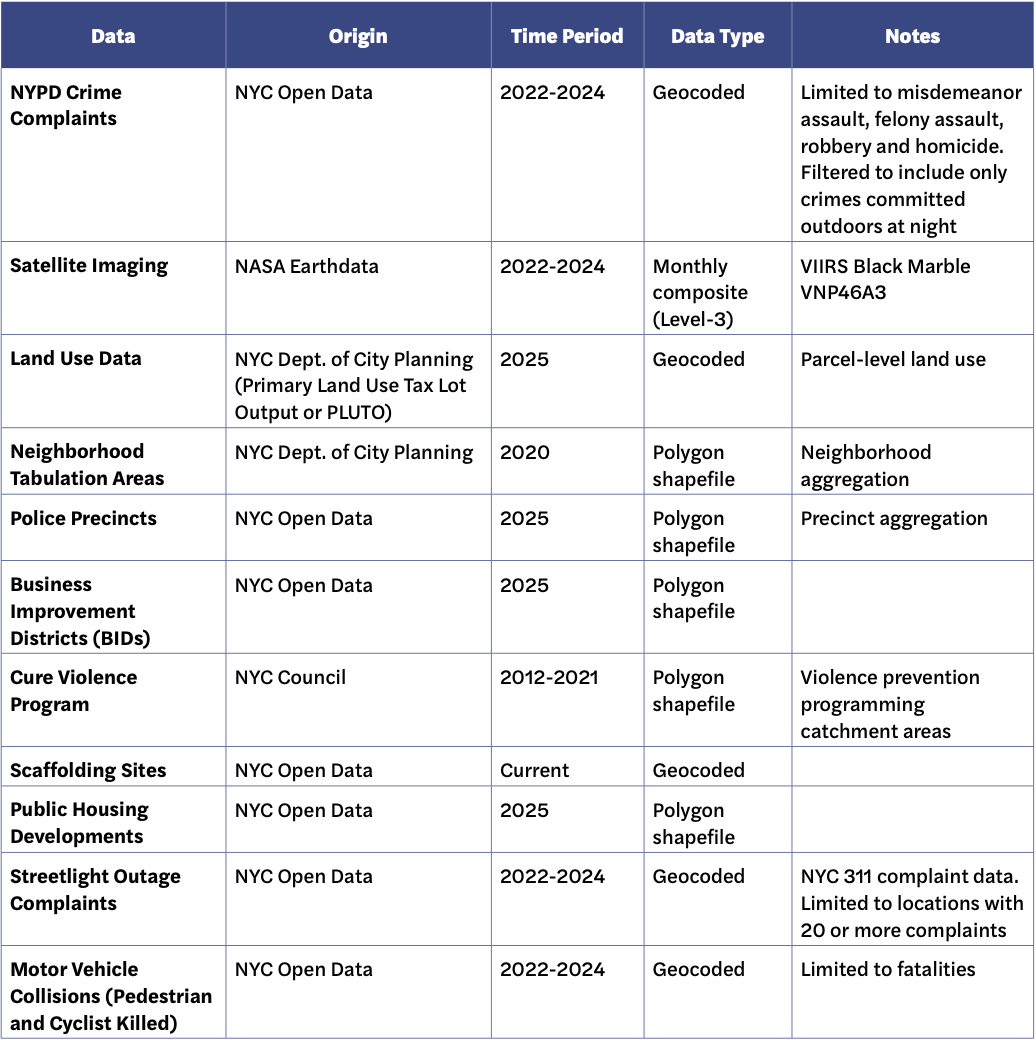
To illustrate the potential uses, Vital City’s prototype tool includes:
- Locations with 20 or more resident complaints about streetlight outages (to highlight places with persistent lighting concerns);
- Land-use data (to assess whether priority areas are concentrated in particular built environments, such as one- and two-family residential areas, mixed-use corridors, industrial areas or open space);
- The geographic boundaries of Business Improvement Districts (areas in which local property owners and businesses pay a special assessment to fund supplemental services, such as extra street cleaning and public space maintenance);
- The locations of public housing developments;
- The catchment areas of local violence prevention programs;
- Active scaffolding permit locations; and
- The locations of pedestrian and cyclist fatalities in traffic crashes.
10) Build an interface
Finally, the city should build an interactive interface for ongoing use.
For the New York City prototype, Vital City built the interface with Mapbox GL JS, hosting the grid polygons, crime points and boundaries as vector layers in Mapbox Studio. Python (pandas, geopandas and numpy) handled the data cleaning, grid construction, spatial joins and percentile calculations. The tool groups its layers so that the default view stays focused on the main output — cells where darkness and crime overlap — while contextual layers can be switched on for deeper exploration.
The tool includes dynamic sliders for both lighting and crime thresholds, allowing users to alter the percentile below which cells count as low lighting and the percentile above which they count as high crime. The map updates in real time as the sliders move. It also displays the actual radiance value and crime count at the selected percentiles, so both technical and nontechnical users can see what the thresholds mean in practice.
Hovering over a cell shows its crime count and average lighting value, and layer toggles and a dynamic legend keep the interface uncluttered.
Limitations
First, Vital City’s analysis of crime and lighting is descriptive and cannot support causal claims. The fact that low lighting and high crime overlap in some places does not mean that low lighting causes crime, nor does it mean that improving lighting alone would reduce future violence. Many other social, environmental and institutional factors shape crime patterns.
Second, the satellite images have a resolution of 500 meters, which yields average brightness over a wide area and masks block-by-block variation. They are not precise enough to zero in on dark corners or problem blocks, and can conceal meaningful differences within a cell. For example, a cell that appears to be dark and has high rates of crime might in fact include a poorly lit, low-crime park on one side of the cell and a well-lit, high-crime street on the other.
Third, the crime data consist of reported incidents only and thus undercount violence. Police departments do not always accurately record whether a crime occurred indoors or outdoors, so outdoor crime may be over- or undercounted.
Fourth, cells with no valid satellite reading in a given month were filled using values from neighboring cells, so for those cells the brightness estimate is inferred rather than observed.
A starting point
Vital City’s tool is a starting point for policymakers, not an endpoint. It provides an initial sense of where crime is high and lighting is low; a cell that clears the thresholds for “high crime” and “low lighting” is a candidate for further review, not a place that is guaranteed to need improvements. To identify which blocks truly need improved lighting, the city should combine the tool’s findings with on-the-ground lighting audits and with the knowledge of the neighborhood’s residents, business owners and others with daily experience of its streets and parks.
Data Appendix
Replicating this analysis for any city requires three datasets:
- NASA VIIRS Black Marble monthly composites (VNP46A3, globally available at 500-meter resolution)
- Geocoded crime data with timestamps (to filter to nighttime incidents using civil twilight) and location fields that distinguish indoor from outdoor settings
- A geographic boundary file for the jurisdiction (city limits, neighborhood boundaries or equivalent)
Each city will have additional datasets of its own to include. To illustrate the tool’s potential, Vital City included the following data in the New York City prototype: